- Products

- Developers
- User stories
- Blog
- Pricing

Build a data visualization using Angular and Chart.js
Introduction
Data visualization is viewed by many disciplines as a modern equivalent of visual communication. It involves the creation and study of the visual representation of data. - Wikipedia
An important advantage of data visualization is how it enables users to more effectively see connections as they are occurring between operating conditions and business performance. Adding realtime functionality using Pusher improves this experience as data changes are witnessed in realtime.
Using Angular you can extend the template language with your own components and use a wide array of existing components.
To follow this tutorial a basic understanding of Angular and Node.js is required. Please ensure that you have Node and npm installed before you begin.
If you have no prior knowledge of Angular, kindly follow the tutorial here. Come back and finish the tutorial when you’re done.
We’ll be using these tools to build our application:
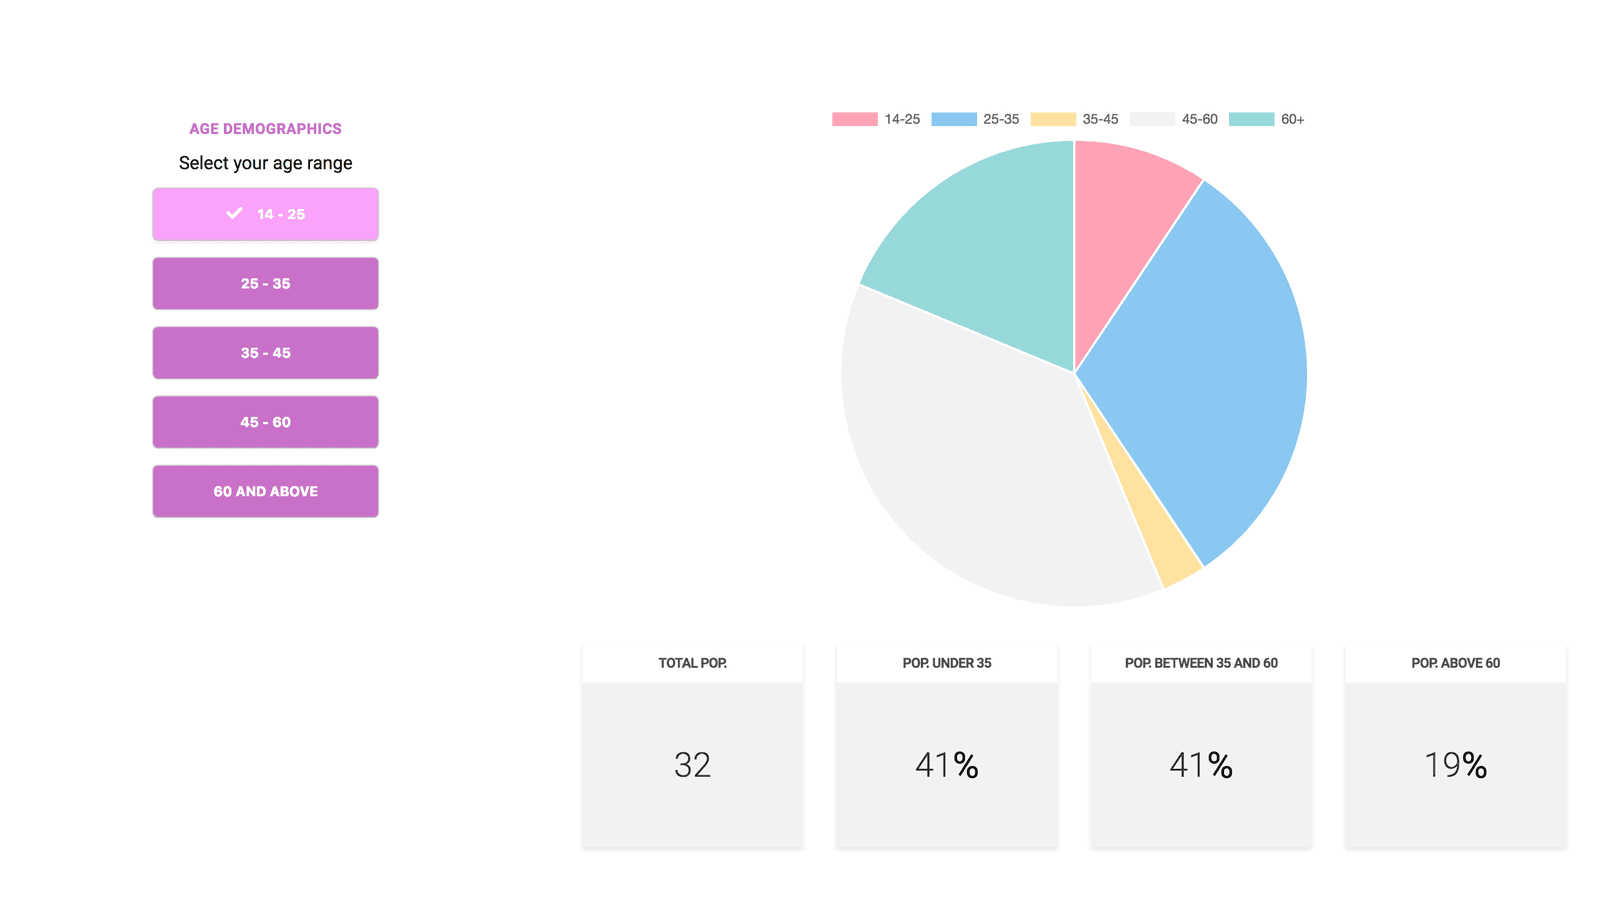
We’ll be creating an application that will present data about the age demographics of a given population. Using our application, users will complete a poll and then see the data from the polls in realtime.
Here’s a screenshot of the final product:
Initializing application and installing dependencies
To get started, we will use the CLI (command line interface) provided by the Angular team to initialize our project.
First, install the CLI by running npm install -g @angular/cli. NPM is a package manager used for installing packages. It will be available on your PC if you have Node installed.
To create a new Angular project using the CLI, open a terminal and run:
ng new angular-data-visualization --style=scss
This command is used to initialize a new Angular project; the project will make use of SCSS for styling.
Next run the following command in the root folder of the project to install dependencies.
1// install depencies required to build the server 2 npm install express body-parser dotenv pusher 3 4 // front-end dependencies 5 npm install chart.js ng2-charts pusher-js
Start the Angular development server by running ng serve in a terminal in the root folder of your project.
Building our server
We’ll build our server using Express. Express is a fast, unopinionated, minimalist web framework for Node.js.
Create a file called server.js in the root of the project and update it with the code snippet below
1// server.js 2 3 require('dotenv').config(); 4 const express = require('express'); 5 const bodyParser = require('body-parser'); 6 const Pusher = require('pusher'); 7 8 const app = express(); 9 const port = process.env.PORT || 4000; 10 const pusher = new Pusher({ 11 appId: process.env.PUSHER_APP_ID, 12 key: process.env.PUSHER_KEY, 13 secret: process.env.PUSHER_SECRET, 14 cluster: 'eu', 15 }); 16 17 app.use(bodyParser.json()); 18 app.use(bodyParser.urlencoded({extended: false})); 19 app.use((req, res, next) => { 20 res.header('Access-Control-Allow-Origin', '*'); 21 res.header( 22 'Access-Control-Allow-Headers', 23 'Origin, X-Requested-With, Content-Type, Accept' 24 ); 25 next(); 26 }); 27 28 app.listen(port, () => { 29 console.log(`Server started on port ${port}`); 30 });
The calls to our endpoint will be coming in from a different origin. Therefore, we need to make sure we include the CORS headers (Access-Control-Allow-Origin). If you are unfamiliar with the concept of CORS headers, you can find more information here.
This is a standard Node application configuration, nothing specific to our app.
Create a Pusher account and a new Pusher Channels app if you haven’t done so yet and get your appId, key and secret. Create a file in the root folder of the project and name it .env. Copy the the following snippet into the .env file and ensure to replace the placeholder values with your Pusher credentials.
1// .env 2 3 // Replace the placeholder values with your actual pusher credentials 4 PUSHER_APP_ID=PUSHER_APP_ID 5 PUSHER_KEY=PUSHER_KEY 6 PUSHER_SECRET=PUSHER_SECRET
We’ll make use of the dotenv library to load the variables contained in the .env file into the Node environment. The dotenv library should be initalized as early as possible in the application.
Send votes
To let users send requests to the server, we’ll create a route to handle incoming requests. Update your server.js file with the code below.
1// server.js 2 require('dotenv').config(); 3 ... 4 5 app.use((req, res, next) => { 6 res.header('Access-Control-Allow-Origin', '*'); 7 ... 8 }); 9 10 11 app.post('/vote', (req, res) => { 12 const {body} = req; 13 const data = { 14 ...body, 15 // set the selected property of the body to true 16 selected: true, 17 }; 18 // trigger a new-entry event on the vote-channel 19 pusher.trigger('vote-channel', 'new-entry', data); 20 res.json(data); 21 }); 22 23 ...
- We added a POST route(
/vote) to handle incoming requests. - Using object destructuring, we got the body of the request.
- The trigger is achieved using the
triggermethod which takes the trigger identifier(vote-channel), an event name (new-entry), and a payload. - The payload being sent contains the body of the request sent in. The
selectedproperty of the payload is set totrue.
Home view
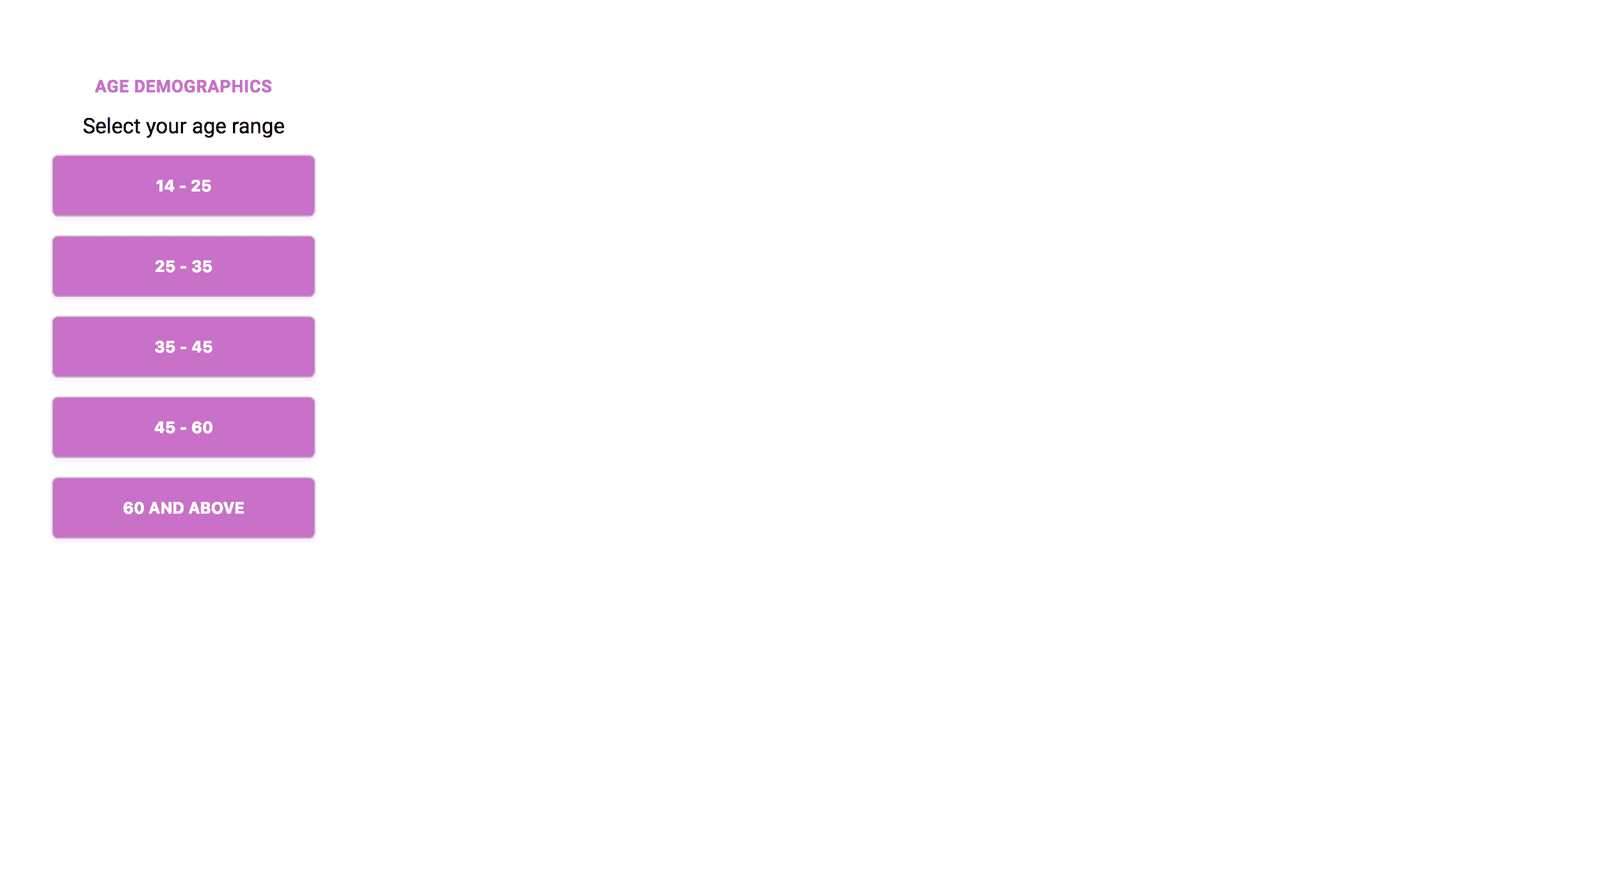
The home view of the project will house both the polling area and the area where the data is visualized. Both views will appear side by side.
Open the app.component.html file and replace it with the content below.
1// app.component.html 2 3 <div class="main"> 4 <div class="section census"> 5 <h4>Age Demographics</h4> 6 <p>Select your age range</p> 7 8 <div class="option-list"> 9 <button class="option" *ngFor="let option of options; index as i" (click)="takeVote(i)" [ngClass]="{selected: option.selected}" 10 11 [disabled]="selectedOption && selectedOption !== option.value"> 12 <i class="fas fa-check" *ngIf="option.selected"></i> 13 {{option.label}} 14 </button> 15 </div> 16 <p class="error">{{message}}</p> 17 </div> 18 19 <div class="section data"> 20 <!-- Include the chart component here --> 21 </div> 22 23 </div>
- In the code snippet above, we looped through
optionsto create a view based on the player’s information. - The
takeVotemethod will make use of theHttpClientto send the user’s selection as a request to the server. - We append a
selectedclass if theoption's selected property is true. - Options are disabled if the current
selectedOptionisn’t equal to the option’svalue.
Variables used will be defined in the component’s Typescript file.
Styling
1// app.component.scss 2 3 $buttonShadow: #ca6eca + 120; 4 .main { 5 display: flex; 6 padding-top: 5%; 7 .section { 8 padding: 20px; 9 } 10 .section.census { 11 flex: 1; 12 display: flex; 13 flex-direction: column; 14 align-items: center; 15 } 16 .data{ 17 flex: 2; 18 } 19 } 20 p.error{ 21 font-size: 13px; 22 color: red + 100; 23 margin: 5px 0; 24 } 25 h4 { 26 margin-bottom: 8px; 27 font-size: 13px; 28 text-transform: uppercase; 29 color: #ca6eca; 30 font-weight: bold; 31 letter-spacing: 0.4px; 32 } 33 p { 34 margin: 5px 0; 35 } 36 div.option-list { 37 padding-left: 0; 38 width: 200px; 39 display: flex; 40 flex-direction: column; 41 button.option { 42 padding: 15px; 43 box-shadow: 0 2px 4px 0 $buttonShadow; 44 margin: 7px 0; 45 background: #ca6eca; 46 color: white; 47 border-radius: 5px; 48 cursor: pointer; 49 font-size: 12px; 50 text-transform: uppercase; 51 font-weight: bold; 52 .fas { 53 font-size: 1.2em; 54 margin-right: 10px; 55 } 56 } 57 button[disabled] { 58 background: #ca6eca; 59 box-shadow: none; 60 cursor: default; 61 } 62 button.selected { 63 background: #ca6eca + 50; 64 } 65 button:focus { 66 background: #ca6eca + 50; 67 outline: none; 68 } 69 }
These styles are meant to add a bit of life to our application. It also helps distinguish between states during application use.
Also, we’ll be using the FontAwesome icon set for our project and the Roboto font. Include a link to their respective stylesheets in the index.html file.
1// index.html 2 3 <head> 4 ... 5 <meta name="viewport" content="width=device-width, initial-scale=1"> 6 <link href="https://fonts.googleapis.com/css?family=Roboto:300,400,500,700" rel="stylesheet"> 7 <link rel="stylesheet" href="https://use.fontawesome.com/releases/v5.0.12/css/all.css" integrity="sha384-G0fIWCsCzJIMAVNQPfjH08cyYaUtMwjJwqiRKxxE/rx96Uroj1BtIQ6MLJuheaO9" crossorigin="anonymous"> 8 ... 9 </head> 10 ...
Then we’ll select Roboto as our default font family. Open the styles.scss file and update it with the following content:
1// styles.scss 2 3 body{ 4 font-family: 'Roboto', sans-serif; 5 }
App component
In the html snippet, we made reference to some variables that weren’t yet defined, we’ll create the variables here with the logic behind our application.
1// app.component.ts 2 3 import {Component, OnInit} from '@angular/core'; 4 import {HttpClient} from '@angular/common/http'; 5 export interface Option { 6 label: string; 7 selected: boolean; 8 value: string; 9 } 10 @Component({ 11 selector: 'app-root', 12 templateUrl: './app.component.html', 13 styleUrls: ['./app.component.scss'] 14 }) 15 export class AppComponent implements OnInit { 16 constructor(private http: HttpClient) { 17 } 18 selectedOption = null; 19 message: string = ''; 20 options: Option[] = [ 21 { 22 label: '14 - 25', 23 selected: false, 24 value: '14-25' 25 }, 26 { 27 label: '25 - 35', 28 selected: false, 29 value: '25-35' 30 }, 31 { 32 label: '35 - 45', 33 selected: false, 34 value: '35-45' 35 }, 36 { 37 label: '45 - 60', 38 selected: false, 39 value: '45-60' 40 }, 41 { 42 label: '60 and above', 43 selected: false, 44 value: '60+' 45 } 46 ]; 47 censusData = { 48 '14-25': 0, 49 '25-35': 0, 50 '35-45': 0, 51 '45-60': 0, 52 '60+': 0 53 }; 54 takeVote(index) { 55 const selectedOption = this.options[index]; 56 if (!selectedOption.selected) { 57 this.http 58 .post('http://localhost:4000/vote', selectedOption) 59 .subscribe((res: Option) => { 60 const options = this.options.map( 61 (option, i) => (index === i ? { ...res } : { ...option }) 62 ); 63 this.options = [...options]; 64 this.selectedOption = res.value; 65 }); 66 } 67 else{ 68 this.message = "You've already placed a vote"; 69 } 70 } 71 onNewEntry(data) { 72 this.censusData[data.value] += 1; 73 } 74 ngOnInit() { 75 } 76 }
-
takeVote: this method makes use of the native HttpClient service to make requests to our server. A request is sent, only if the user hasn’t made a previous selection. When a response is returned, it loops through the availableoptionsand replaces the selected option with the data returned from the request. TheselectedOptionproperty is then set to the value of the response. -
censusData: this will be used when we create the charts view. -
onNewEntry: this method will be used to update thecensusDatawhenever there’s a new Pusher event. We’ll use this method after we’ve created the chart component.
To make use of the HttpClient service, we’ll need to import the HttpClientModule into the app.module.ts file. Update your app module file as follows:
1// app.module.ts 2 import { BrowserModule } from '@angular/platform-browser'; 3 import { NgModule } from '@angular/core'; 4 import { AppComponent } from './app.component'; 5 import {HttpClientModule} from '@angular/common/http'; 6 7 .... 8 @NgModule({ 9 declarations: [AppComponent], 10 imports: [BrowserModule, HttpClientModule], 11 providers: [], 12 bootstrap: [AppComponent], 13 }) 14 ....
Let’s check how our application looks at this point. Make sure the server(node server) and Angular’s dev server(ng serve) are both running.
Introducing Pusher
So far we have an application that allows users be a part of the polling process but data updates aren’t happening in realtime. Let’s create a service that will make it easier to include Pusher in our components.
To make the pusher library available in our project, add the library as a third party script to be loaded by Angular CLI. All CLI config is stored in .angular-cli.json file. Modify the scripts property to include the link to pusher.min.js.
1// .angular-cli.json 2 ... 3 "scripts": [ 4 "../node_modules/pusher-js/dist/web/pusher.min.js", 5 ] 6 ...
After updating this file, you’ll need to restart the angular server so that the CLI compiles the new script files added.
Now we’ll create a Pusher service to be used application wide. The Angular CLI can aid in the service creation. Open a terminal in your project’s root folder and run the following command.
ng generate service pusher
This command simply tells the CLI to generate a service named pusher. Now open the pusher.service.ts file and update it with the code below.
1// pusher.service.ts 2 import { Injectable } from '@angular/core'; 3 declare const Pusher: any; 4 5 @Injectable() 6 export class PusherService { 7 constructor() { 8 const pusher = new Pusher('PUSHER_KEY', { 9 cluster: 'eu', 10 }); 11 this.channel = pusher.subscribe('vote-channel'); 12 } 13 channel; 14 public init() { 15 return this.channel; 16 } 17 }
- First, we initialize Pusher in the constructor.
- The
initmethod returns the Pusher property we created.
Note: ensure you replace the
PUSHER_KEYstring with your actual Pusher key.
To make the service available application wide, import it into the app.module.ts file.
1// app.module.ts 2 import {PusherService} from './pusher.service' 3 ... 4 5 @NgModule({ 6 .... 7 providers: [PusherService], 8 .... 9 })
Charts component
To visualize the data in our application, we’ll be making use of Chart.js to create charts and present the data in a graphical format. Let’s create the charts component using the CLI by running the following command:
ng generate component charts
Open the charts.component.html file and update it with the contents below:
1// charts.component.html 2 3 <div> 4 <canvas baseChart [chartType]="chartType" [labels]="chartLabels" [data]="chartData"> 5 </canvas> 6 </div> 7 <div class="stats"> 8 <div class="stat"> 9 <div class="header"> 10 <p>Total Pop.</p> 11 </div> 12 <div class="body"><h4>{{totalPopulation}}</h4></div> 13 </div> 14 <div class="stat"> 15 <div class="header"> 16 <p>Pop. under 35</p> 17 </div> 18 <div class="body"> 19 <h4>{{under35 || 0}}</h4> 20 <span class="percent">%</span> 21 </div> 22 </div> 23 <div class="stat"> 24 <div class="header"> 25 <p>Pop. between 35 and 60</p> 26 </div> 27 <div class="body"> 28 <h4>{{between35and60 || 0}}</h4> 29 <span class="percent">%</span> 30 </div> 31 </div> 32 <div class="stat"> 33 <div class="header"> 34 <p>Pop. above 60</p> 35 </div> 36 <div class="body"> 37 <h4>{{above60 || 0}}</h4> 38 <span class="percent">%</span> 39 </div> 40 </div> 41 </div>
Style up the component by adding the following styles to the charts.component.scss file:
1// charts.component.scss 2 3 .stats { 4 display: flex; 5 margin-top: 30px; 6 .stat { 7 flex: 1; 8 box-shadow: 0 2px 4px 0 rgba(0,0,0,0.10); 9 margin: 0 15px; 10 background: rgba(0, 0, 0, 0.05); 11 .header { 12 background: white; 13 padding: 10px 5px; 14 p { 15 font-size: 12px; 16 margin: 0; 17 font-weight: bold; 18 text-transform: uppercase; 19 letter-spacing: -.4px; 20 text-align: center; 21 opacity: .7; 22 } 23 } 24 .body { 25 display: flex; 26 justify-content: center; 27 align-items: center; 28 padding: 15px; 29 h4 { 30 text-align: center; 31 font-size: 30px; 32 font-weight: 300; 33 opacity: 0.8; 34 } 35 .percent{ 36 font-size: 32px; 37 } 38 } 39 } 40 }
Add the following content to the charts.component.ts file:
1// charts.component.ts 2 3 import {Component, EventEmitter, Input, OnInit, Output} from '@angular/core'; 4 import {PusherService} from '../pusher.service'; 5 import {Option} from '../app.component'; 6 @Component({ 7 selector: 'app-charts', 8 templateUrl: './charts.component.html', 9 styleUrls: ['./charts.component.scss'] 10 }) 11 export class ChartsComponent implements OnInit { 12 constructor(private pusher: PusherService) { 13 } 14 @Input() censusData = {}; 15 @Output() newEntry: EventEmitter<Option> = new EventEmitter(); 16 chartType = 'pie'; 17 chartData = []; 18 chartLabels = []; 19 totalPopulation = 0; 20 under35 = 0; 21 between35and60 = 0; 22 above60 = 0; 23 24 computeData() { 25 this.chartData = Object.values(this.censusData); 26 this.chartLabels = Object.keys(this.censusData); 27 this.totalPopulation = this.getTotalPopulation(); 28 this.under35 = Math.round(this.getPopulationUnder35()); 29 this.between35and60 = Math.round(this.getPopulationBetween35and60()); 30 this.above60 = Math.round(this.getPopulationAbove60()); 31 } 32 33 getTotalPopulation() { 34 const values: number[] = Object.values(this.censusData); 35 return values.reduce((defaultValue, val) => defaultValue + val, 0); 36 } 37 38 getPopulationUnder35() { 39 const total = this.getTotalPopulation(); 40 const populationUnder35 = Object.keys(this.censusData).reduce( 41 (initVal, val) => { 42 if (val === '14-25' || val === '25-35') { 43 return initVal + this.censusData[val]; 44 } 45 return initVal; 46 }, 47 0 48 ); 49 return populationUnder35 / total * 100; 50 } 51 52 getPopulationBetween35and60() { 53 const total = this.getTotalPopulation(); 54 const populationBetween35and60 = Object.keys(this.censusData).reduce( 55 (initVal, val) => { 56 if (val === '35-45' || val === '45-60') { 57 return initVal + this.censusData[val]; 58 } 59 return initVal; 60 }, 61 0 62 ); 63 return populationBetween35and60 / total * 100; 64 } 65 66 getPopulationAbove60() { 67 const total = this.getTotalPopulation(); 68 const above60 = Object.keys(this.censusData).reduce((initVal, val) => { 69 if (val === '60+') { 70 return initVal + this.censusData[val]; 71 } 72 return initVal; 73 }, 0); 74 return above60 / total * 100; 75 } 76 77 ngOnInit() { 78 this.computeData(); 79 const channel = this.pusher.init(); 80 channel.bind('new-entry', (data: Option) => { 81 this.newEntry.emit(data); 82 this.computeData(); 83 }); 84 } 85 }
We’ve defined a few methods for computing the data to be used in the view:
-
getPopulation: this method maps the values to an array and gets the total amount of people that took part in the polls. -
getPopulationUnder35: this method checks for the percentage of the people under the age of 35 taking part in the polls. -
getPopulationBetween35and60: in this method, we loop through the data and check for the percentage of users between the age of 35 and 60. -
getPopulationAbove60: using this method we get the percentage of people over the age of 60. -
Finally, in the
computeDatamethod, we run the different methods to get the required data for the view. -
In the
ngOnInitlifecycle, we call thecomputeDatamethod. Also, we listen for thenew-entryevent on the Pusher channel.
To make use of the ng2-charts package, we’ll have to import the ChartsModule into our module file. Also, we’ll have to load the chart.js into our application by including it into the .angular-cli.json file.
Update the app.module.ts file like so:
1// app.module.ts 2 ... 3 import { ChartsComponent } from './charts/charts.component'; 4 import {ChartsModule} from 'ng2-charts'; 5 6 @NgModule({ 7 declarations: [ 8 ... 9 ], 10 imports: [ 11 BrowserModule, 12 HttpClientModule, 13 ChartsModule 14 ], 15 ... 16 }) 17 ...
Include the chart.js file in the .angular-cli.json file. Update the CLI file like so:
1// .angular-cli.json 2 ... 3 "scripts": [ 4 "../node_modules/pusher-js/dist/web/pusher.min.js", 5 "../node_modules/chart.js/dist/Chart.min.js" 6 ], 7 ...
Update the app.component.html file to include the Charts component.
1// app.component.html 2 <div class="main"> 3 <div class="section census" 4 ... 5 </div> 6 7 <div class="section data"> 8 // include the charts component here 9 <app-charts [censusData]="censusData" (newEntry)="onNewEntry($event)"> 10 </app-charts> 11 </div
At this point, your application should have realtime updates when votes are placed. Ensure that the server is running alongside the Angular development server. If not, run node server and ng serve in two separate terminals. Both terminals should be opened in the root folder of your project.
To test the realtime functionality of the application, open two browsers side-by-side and engage the application. Data updates should be in realtime.
Conclusion
Using Pusher, we’ve built out an application using the pub/sub pattern to recieve realtime updates. With the help of Chart.js, our data was well presented using charts. You can check out the repo containing the demo on GitHub.


© 2024 Pusher Ltd. All rights reserved.
Pusher Limited is a company registered in England and Wales (No. 07489873) whose registered office is at MessageBird UK Limited, 3 More London Riverside, 4th Floor, London, United Kingdom, SE1 2AQ.