- Products

- Developers
- User stories
- Blog
- Pricing

Build a live graph with D3.js
Introduction
Visual representations of data are one of the most effective means of conveying complex information and D3.js provides great tools and flexibility to create these data visualizations.
D3.js is a JavaScript library used for producing dynamic, interactive data visualizations in web browsers using SVG, HTML and CSS.
In this tutorial, we'll explore how to build a realtime graph with D3.js and Pusher Channels. If you want to play around with the code as you read this tutorial, check out this GitHub repository, which contains the final version of the code.
Prerequisites
To complete this tutorial, you need to have Node.js and npm installed. The versions I used while creating this tutorial are as follows:
- Node.js v10.4.1
- npm v6.3.0
You also need to have http-server installed on your machine. It can be installed through npm by running the following command: npm install http-server.
Although no Pusher Channels knowledge is required, a basic familiarity with JavaScript and D3.js will be helpful.
Getting started
To get started, create a new directory for the app we will build. Call it realtime-graph or whatever you like. Inside the newly created directory, create a new index.html file and paste in the following code:
1//index.html
2
3 <!DOCTYPE html>
4 <hml lang="en">
5 <head>
6 <meta charset="UTF-8">
7 <meta name="viewport" content="width=device-width, initial-scale=1.0">
8 <meta http-equiv="X-UA-Compatible" content="ie=edge">
9 <link rel="stylesheet" href="style.css">
10 <title>Realtime D3 Chart</title>
11 </head>
12 <body>
13
14 <script src="https://js.pusher.com/4.2/pusher.min.js"></script>
15 <script src="https://d3js.org/d3.v5.min.js"></script>
16 <script src="app.js"></script>
17 </body>
18 </html>
As you can see, the HTML file is just pulling up the styles and scripts we need to build the graph. We're making use of D3.js to build the chart and Pusher Channels to add realtime functionality. The app.js file is where the code for the frontend of the app will be written.
Before we start implementing the chart, let's add the styles for the app in style.css:
1// style.css 2 3 html { 4 height: 100%; 5 box-sizing: border-box; 6 padding: 0; 7 margin: 0; 8 } 9 10 *, *::before, *::after { 11 box-sizing: inherit; 12 } 13 14 body { 15 height: 100%; 16 font-family: -apple-system, BlinkMacSystemFont, "Segoe UI", Roboto, Oxygen-Sans, Ubuntu, Cantarell, "Helvetica Neue", sans-serif; 17 overflow: hidden; 18 background: linear-gradient(135deg, #ffffff 0%,#e8f1f5 100%); 19 } 20 21 .container { 22 position: absolute; 23 padding: 20px; 24 top: 50%; 25 left: 50%; 26 background-color: white; 27 border-radius: 4px; 28 transform: translate(-50%, -50%); 29 box-shadow: 0px 50px 100px 0px rgba(0,0,102,0.1); 30 text-align: center; 31 } 32 33 .container h1 { 34 color: #333; 35 } 36 37 .bar { 38 fill: #6875ff; 39 border-radius: 2px; 40 } 41 42 .bar:hover { 43 fill: #1edede; 44 } 45 46 .tooltip { 47 opacity: 0; 48 background-color: rgb(170, 204, 247); 49 padding: 5px; 50 border-radius: 4px; 51 transition: opacity 0.2s ease; 52 }
Install the server dependencies
Assuming you have Node and npm installed, run the following command to install all the dependencies we will need for the server component of the application:
npm install express dotenv cors pusher
Set up Pusher Channels
To get started with Pusher Channels, sign up for a free Pusher account. Then go to the dashboard and create a new Channels app.
Once your app is created, retrieve your credentials from the API Keys tab, then add the following to a new variables.env file in the root of your project directory.
1// variables.env 2 3 PUSHER_APP_ID=<your app id> 4 PUSHER_APP_KEY=<your app key> 5 PUSHER_APP_SECRET=<your app secret> 6 PUSHER_APP_CLUSTER=<your app cluster>
Set up the server
Now that we've installed the relevant dependencies and our Pusher account has been setup, we can start building the server.
Create a new file called server.js in the root of your project directory and paste in the following code:
1// server.js 2 3 require('dotenv').config({ path: 'variables.env' }); 4 const express = require('express'); 5 const cors = require('cors'); 6 7 const poll = [ 8 { 9 name: 'Chelsea', 10 votes: 100, 11 }, 12 { 13 name: 'Arsenal', 14 votes: 70, 15 }, 16 { 17 name: 'Liverpool', 18 votes: 250, 19 }, 20 { 21 name: 'Manchester City', 22 votes: 689, 23 }, 24 { 25 name: 'Manchester United', 26 votes: 150, 27 }, 28 ]; 29 30 const app = express(); 31 app.use(cors()); 32 33 app.get('/poll', (req, res) => { 34 res.json(poll); 35 }); 36 37 app.set('port', process.env.PORT || 4000); 38 const server = app.listen(app.get('port'), () => { 39 console.log(`Express running → PORT ${server.address().port}`); 40 });
Save the file and run node server.js from the root of your project directory to start the server.
Set up the app frontend
The frontend of the application will be written in the app.js file we referenced earlier. Create this file in the root of your project directory and paste the following code therein:
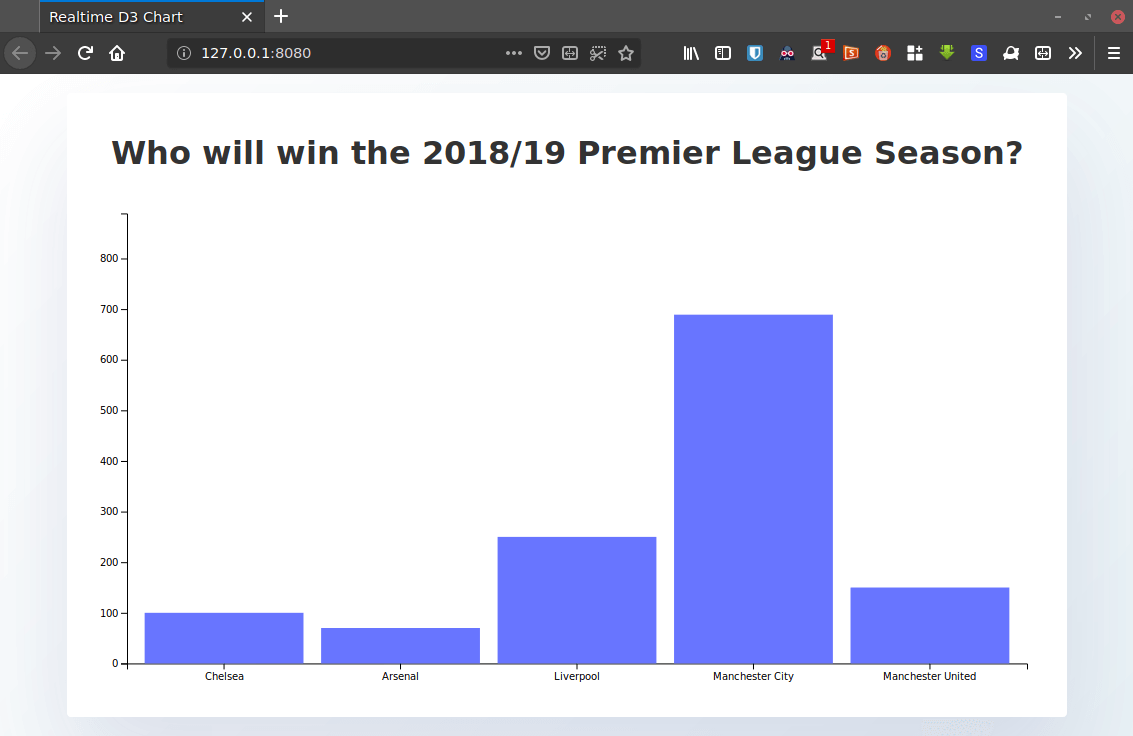
1// app.js 2 3 // set the dimensions and margins of the graph 4 const margin = { top: 20, right: 20, bottom: 30, left: 40 }; 5 const width = 960 - margin.left - margin.right; 6 const height = 500 - margin.top - margin.bottom; 7 8 // set the ranges for the graph 9 const x = d3 10 .scaleBand() 11 .range([0, width]) 12 .padding(0.1); 13 14 const y = d3.scaleLinear().range([height, 0]); 15 16 // append the container for the graph to the page 17 const container = d3 18 .select('body') 19 .append('div') 20 .attr('class', 'container'); 21 22 container.append('h1').text('Who will win the 2018/19 Premier League Season?'); 23 24 // append the svg object to the body of the page 25 // append a 'group' element to 'svg' 26 // moves the 'group' element to the top left margin 27 const svg = container 28 .append('svg') 29 .attr('width', width + margin.left + margin.right) 30 .attr('height', height + margin.top + margin.bottom) 31 .append('g') 32 .attr('transform', 'translate(' + margin.left + ',' + margin.top + ')'); 33 34 // Create a skeleton structure for a tooltip and append it to the page 35 const tip = d3 36 .select('body') 37 .append('div') 38 .attr('class', 'tooltip'); 39 40 // Get the poll data from the `/poll` endpoint 41 fetch('http://localhost:4000/poll') 42 .then(response => response.json()) 43 .then(poll => { 44 // add the x Axis 45 svg 46 .append('g') 47 .attr('transform', 'translate(0,' + height + ')') 48 .attr('class', 'x-axis') 49 .call(d3.axisBottom(x)); 50 51 // add the y Axis 52 svg 53 .append('g') 54 .attr('class', 'y-axis') 55 .call(d3.axisLeft(y)); 56 57 update(poll); 58 }); 59 60 function update(poll) { 61 // Scale the range of the data in the x axis 62 x.domain( 63 poll.map(d => { 64 return d.name; 65 }) 66 ); 67 68 // Scale the range of the data in the y axis 69 y.domain([ 70 0, 71 d3.max(poll, d => { 72 return d.votes + 200; 73 }), 74 ]); 75 76 // Select all bars on the graph, take them out, and exit the previous data set. 77 // Enter the new data and append the rectangles for each object in the poll array 78 svg 79 .selectAll('.bar') 80 .remove() 81 .exit() 82 .data(poll) 83 .enter() 84 .append('rect') 85 .attr('class', 'bar') 86 .attr('x', d => { 87 return x(d.name); 88 }) 89 .attr('width', x.bandwidth()) 90 .attr('y', d => { 91 return y(d.votes); 92 }) 93 .attr('height', d => { 94 return height - y(d.votes); 95 }) 96 .on('mousemove', d => { 97 tip 98 .style('position', 'absolute') 99 .style('left', `${d3.event.pageX + 10}px`) 100 .style('top', `${d3.event.pageY + 20}px`) 101 .style('display', 'inline-block') 102 .style('opacity', '0.9') 103 .html( 104 `<div><strong>${d.name}</strong></div> <span>${d.votes} votes</span>` 105 ); 106 }) 107 .on('mouseout', () => tip.style('display', 'none')); 108 109 // update the x-axis 110 svg.select('.x-axis').call(d3.axisBottom(x)); 111 112 // update the y-axis 113 svg.select('.y-axis').call(d3.axisLeft(y)); 114 }
In the code block above, we've created a basic bar chart using the initial data received via the /poll endpoint. If you're familiar with how D3 works, the code should be familiar to you. I've added comments in key parts of the code to walk you through how the chart is constructed.
In a new terminal, start a development server to serve the index.html file:
npx http-server
I'm using http-server here, but you can use whatever server you want. You can even open index.html in the browser directly.
At this point, your graph should look like this:
Update the graph in realtime with Pusher Channels
Let's make sure that updates to the poll can be reflected in the app's frontend in realtime with Pusher Channels. Paste the following code at the end of the app.js file.
1// app.js 2 3 const pusher = new Pusher('<your app key>', { 4 cluster: '<your app cluster>', 5 encrypted: true, 6 }); 7 8 const channel = pusher.subscribe('poll-channel'); 9 channel.bind('update-poll', data => { 10 update(data.poll); 11 });
Here, we opened a connection to Channels and used the subscribe() method from Pusher to subscribe to a new channel called poll-channel. Updates to the poll are listened for via the bind method, and the update() function is invoked with the latest data once an update is received so that the graph is re-rendered.
Don’t forget to replace the <your app key> and <your app cluster> placeholders with the appropriate details from your Pusher account dashboard.
Trigger updates from the server
We're going to simulate a poll that updates every second and use Pusher to trigger an update when the data changes so that subscribers to the poll (the client) can receive the updated data in realtime.
Add the following code at the top of server.js below the other imports:
1const Pusher = require('pusher'); 2 3 const pusher = new Pusher({ 4 appId: process.env.PUSHER_APP_ID, 5 key: process.env.PUSHER_APP_KEY, 6 secret: process.env.PUSHER_APP_SECRET, 7 cluster: process.env.PUSHER_APP_CLUSTER, 8 encrypted: true, 9 }); 10 11 function getRandomNumber(min, max) { 12 return Math.floor(Math.random() * (max - min) + min); 13 } 14 15 function increment() { 16 const num = getRandomNumber(0, poll.length); 17 poll[num].votes += 20; 18 } 19 20 function updatePoll() { 21 setInterval(() => { 22 increment(); 23 pusher.trigger('poll-channel', 'update-poll', { 24 poll, 25 }); 26 }, 1000); 27 }
Then change the /poll endpoint to look like this:
1app.get('/poll', (req, res) => { 2 res.json(poll); 3 updatePoll(); 4 });
The /poll route sends the initial poll data to the client and calls the updatePoll() function which increments the votes for a random club at three second intervals and triggers an update on the poll-channel which we created on the client in the last step.
Kill your server and restart it by running node server.js from the root of your project directory. At this point, you should have a bar graph that updates in realtime.
Conclusion
You have seen the procedure for creating a bar graph with D3.js and how to it in realtime with Pusher Channels. It was easy enough, wasn't it?
We have covered a simple use case for Pusher Channels and D3 but one that's only scratching the surface. I recommend digging into the docs to find more about Pusher and other awesome features it has.
Thanks for reading! Remember that you can find the complete source code for this tutorial in this GitHub repository.


© 2024 Pusher Ltd. All rights reserved.
Pusher Limited is a company registered in England and Wales (No. 07489873) whose registered office is at MessageBird UK Limited, 3 More London Riverside, 4th Floor, London, United Kingdom, SE1 2AQ.