- Products

- Developers
- User stories
- Blog
- Pricing

Realtime data visualization using Next.js and Chart.js
Introduction
When we talk about data visualization, what immediately comes to mind is analytics or some kind of statistical charts that help present data in a pictorial form. Using realtime technologies, it becomes possible to update the visualization as the data changes. This is no longer something new since virtually every data analytics service provides data visualization in realtime. However, as new technologies roll out, newer ways of creating realtime data visualization experiences emerge.
In this tutorial, we’ll build a very simple realtime data visualization application based on the data we get from a poll.
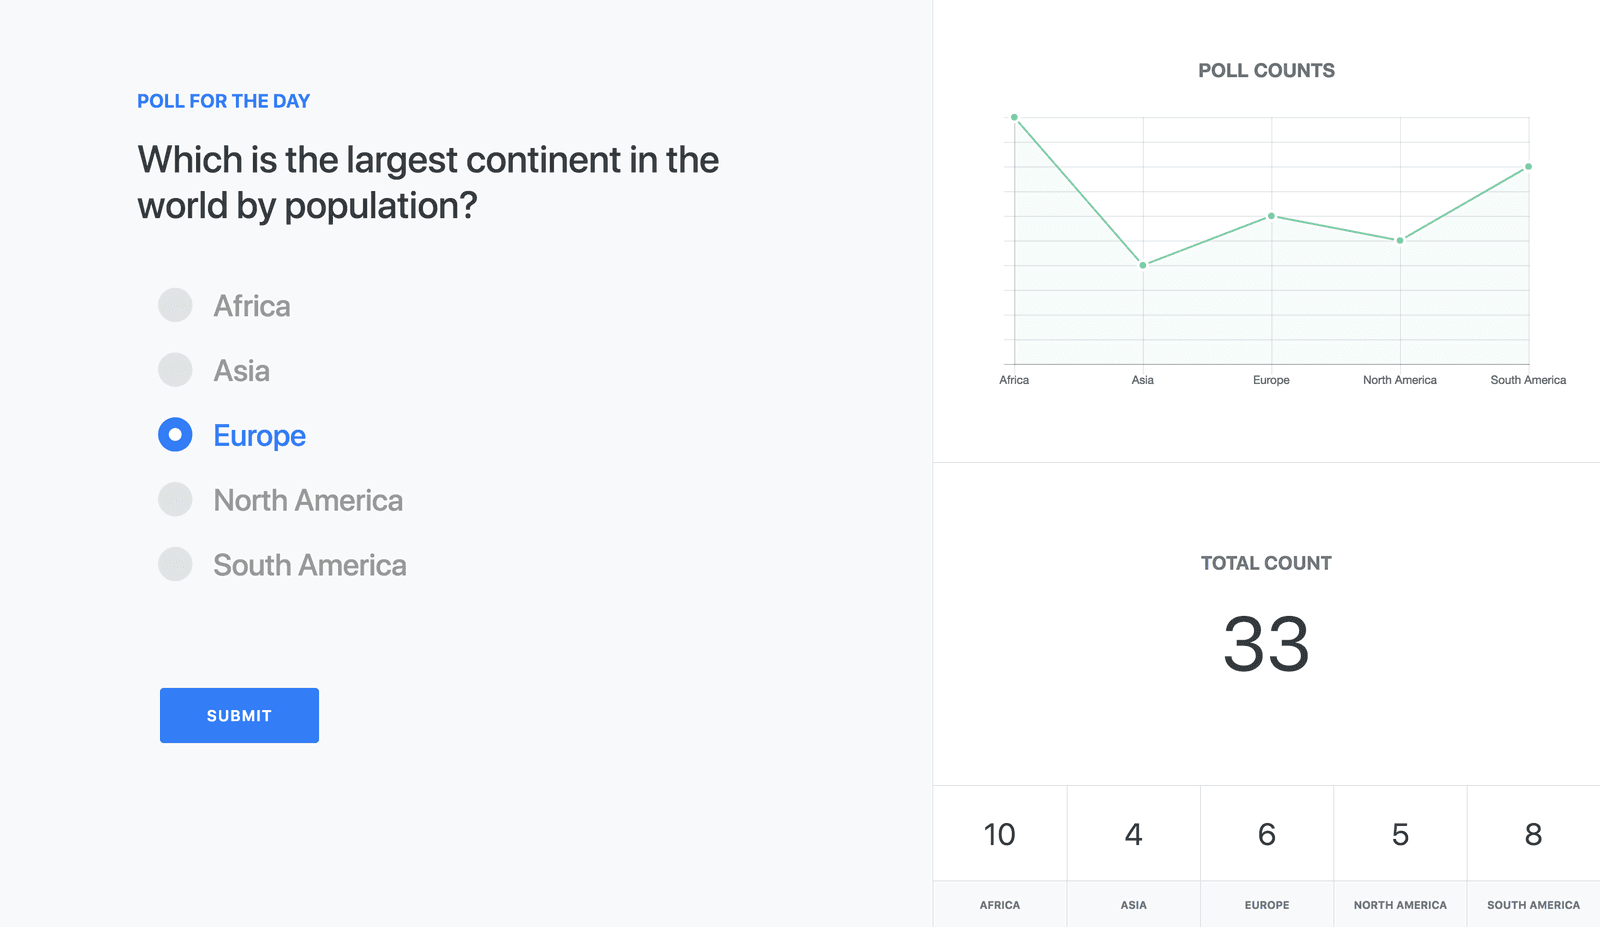
Here is a screenshot of what we will end up building in this tutorial.
Prerequisites
Before you begin, ensure that you have Node and npm or Yarn installed on your machine. Here is a run-down of the core technologies we will be using.
- Next.js - A framework for building server-side rendered(SSR) React applications with ease. It handles most of the challenges that come with building SSR React apps.
- Pusher - Create a free sandbox Pusher account or sign in.
- Chart.js - Chart.js is a simple yet flexible JavaScript charting library that makes it possible to create different types of data visualization charts via a programmable interface.
- React - A very popular JavaScript DOM rendering framework for building scalable web applications using a component-based architecture.
- A few other libraries will be used as we will see in a moment. Also ensure that you have Node installed on your machine.
Installing dependencies
Create a new directory for the application and run the following command to install the required dependencies for the app.
1# Create a new directory 2 mkdir realtime-visualization-app 3 4 # cd into the new directory 5 cd realtime-visualization-app 6 7 # Initiate a new package and install app dependencies 8 npm init -y 9 10 npm install react react-dom next pusher pusher-js chart.js react-chartjs-2 11 npm install express body-parser cors dotenv axios 12 npm install --save-dev cross-env npm-run-all
Setting environment variables
Create a new application on the Pusher dashboard to get your application credentials. Create a .env file in the root directory of your application and add your application credentials as follows.
1PUSHER_APP_ID=YOUR_APP_ID 2 PUSHER_APP_KEY=YOUR_APP_KEY 3 PUSHER_APP_SECRET=YOUR_APP_SECRET 4 PUSHER_APP_CLUSTER=YOUR_APP_CLUSTER
Ensure that you use the same variable names as specified in the above snippet. We will refer to them at several points in our code.
Next create a Next configuration file named next.config.js in the root directory of your application with the following content:
1/* next.config.js */ 2 3 const webpack = require('webpack'); 4 require('dotenv').config(); 5 6 module.exports = { 7 webpack: config => { 8 const env = Object.keys(process.env).reduce((acc, curr) => { 9 acc[`process.env.${curr}`] = JSON.stringify(process.env[curr]); 10 return acc; 11 }, {}); 12 13 config.plugins.push(new webpack.DefinePlugin(env)); 14 15 return config; 16 } 17 };
Since Next.js uses Webpack in the background for module loading and bundling, we are simply configuring Webpack to be able to provide the environment variables we have defined and make them available to our React components by accessing the process.env object.
Getting started
Setting up the server
We will go ahead to setup a simple server using Next.js to wrap an Express application server. We will also load the necessary middlewares for the Express server and then we will configure Pusher using the credentials we added to our environment variables.
Create a server.js file in the root directory of your application and add the following code snippet to setup the server:
1/* server.js */ 2 3 const cors = require('cors'); 4 const next = require('next'); 5 const Pusher = require('pusher'); 6 const express = require('express'); 7 const bodyParser = require('body-parser'); 8 const dotenv = require('dotenv').config(); 9 10 const dev = process.env.NODE_ENV !== 'production'; 11 const port = process.env.PORT || 3000; 12 13 const app = next({ dev }); 14 const handler = app.getRequestHandler(); 15 16 // Ensure that your pusher credentials are properly set in the .env file 17 // Using the specified variables 18 const pusher = new Pusher({ 19 appId: process.env.PUSHER_APP_ID, 20 key: process.env.PUSHER_APP_KEY, 21 secret: process.env.PUSHER_APP_SECRET, 22 cluster: process.env.PUSHER_APP_CLUSTER, 23 encrypted: true 24 }); 25 26 app.prepare() 27 .then(() => { 28 29 const server = express(); 30 31 server.use(cors()); 32 server.use(bodyParser.json()); 33 server.use(bodyParser.urlencoded({ extended: true })); 34 35 server.get('*', (req, res) => { 36 return handler(req, res); 37 }); 38 39 server.listen(port, err => { 40 if (err) throw err; 41 console.log(`> Ready on http://localhost:${port}`); 42 }); 43 44 }) 45 .catch(ex => { 46 console.error(ex.stack); 47 process.exit(1); 48 });
Modify npm scripts
Finally, we will modify the "scripts" section of the package.json file to look like the following snippet:
1/* package.json */ 2 3 "scripts": { 4 "dev": "node server.js", 5 "build": "next build", 6 "prod:server": "cross-env NODE_ENV=production node server.js", 7 "start": "npm-run-all -s build prod:server" 8 }
We have gotten all we need to start building our app components. If you run the command npm run dev on your terminal now, it will start up the application server on port 3000 if it is available. However, nothing happens on the browser yet, because we have not built any index page component. Let's start building the app components.
Building the index page
Next.js requires that you create the page components of your app in a pages directory. We will go ahead and create a pages directory in our app root directory and create a new index.js file inside it for the index page of our application.
It is considered a good practice to have a layout that can be reused across multiple pages. It gives you a form of boilerplate and saves you from unnecessary repetitions.
Before we add content to the index page, we will build a Layout component that can be used in our app pages as a boilerplate. Go ahead and create a components directory in your app root. Create a new Layout.js file inside the just created components directory with the following content:
1/* components/Layout.js */ 2 3 import React, { Fragment } from 'react'; 4 import Head from 'next/head'; 5 6 const Layout = props => ( 7 <Fragment> 8 <Head> 9 <meta charSet="utf-8" /> 10 <meta name="viewport" content="width=device-width, initial-scale=1, shrink-to-fit=no" /> 11 <link rel="stylesheet" href="https://maxcdn.bootstrapcdn.com/bootstrap/4.0.0/css/bootstrap.min.css" integrity="sha384-Gn5384xqQ1aoWXA+058RXPxPg6fy4IWvTNh0E263XmFcJlSAwiGgFAW/dAiS6JXm" crossOrigin="anonymous" /> 12 <title>{props.pageTitle || 'Realtime Data Visualization'}</title> 13 </Head> 14 {props.children} 15 </Fragment> 16 ); 17 18 export default Layout;
Here, we try not to do so much. We are simply using the next/head component to add meta information to the <head> of our pages. We have also added a link to the Bootstrap CDN file to add some default styling to our app. We are also setting the page title dynamically from props and rendering the page contents using {props.children}.
Now let's go ahead and add content to the index.js file we created earlier:
1/* pages/index.js */ 2 3 import React, { Component, Fragment } from 'react'; 4 import axios from 'axios'; 5 import Pusher from 'pusher-js'; 6 import Layout from '../components/Layout'; 7 8 class IndexPage extends Component { 9 10 render() { 11 return ( 12 <Layout pageTitle="Realtime Data Visualization"> 13 <main className="container-fluid position-absolute h-100 bg-light"> 14 <div className="row position-absolute w-100 h-100"> 15 16 <section className="col-md-7 d-flex flex-row flex-wrap align-items-center align-content-center px-5 border-right border-gray"></section> 17 18 <section className="col-md-5 position-relative d-flex flex-wrap h-100 align-items-start align-content-between bg-white px-0"></section> 19 20 </div> 21 </main> 22 </Layout> 23 ); 24 } 25 26 } 27 28 export default () => ( 29 <Fragment> 30 <IndexPage /> 31 </Fragment> 32 );
We are simply rendering container elements to the DOM with some basic styling using built-in classes provided by Bootstrap. If you view the app now on your browser, you will see a blank page with divisions for the two <section> tags.
We will need two components, one in each of the two <section> tags we just created. First, we will have a Poll component for the poll’s question and answers. And then a Stats component for the data visualization. Let’s go ahead and build the Poll component.
Building the poll component
Create a new Poll.js file inside the components directory and add the following content:
1/* components/Poll.js */ 2 3 import React, { Component, Fragment } from 'react'; 4 import axios from 'axios'; 5 6 class Poll extends Component { 7 8 state = { selected: null } 9 10 handleSubmit = evt => { 11 axios.post('/answer', { choice: this.state.selected }); 12 this.setState({ selected: null }); 13 } 14 15 render() { 16 17 const { selected: selectedChoice } = this.state; 18 const { question = null, choices = [] } = this.props; 19 20 return ( 21 <Fragment> 22 23 <span className="d-block w-100 h5 text-uppercase text-primary font-weight-bold mb-4" style={{ marginTop: -50 }}>Poll for the Day</span> 24 25 <span className="d-block w-100 h1 text-dark">{question}</span> 26 27 <div className="my-5 pt-0 pb-5"> 28 { 29 choices.map((choice, index) => { 30 31 const handleClick = selected => evt => this.setState({ selected }); 32 33 const selected = selectedChoice && selectedChoice === choice; 34 35 const labelClass = ['custom-control-label pl-5 position-relative', selected ? 'checked' : ''].join(' '); 36 37 return ( 38 <div key={index} className="custom-control custom-radio py-3 ml-2 d-flex align-items-center"> 39 <input className="custom-control-input" type="radio" name="poll-response" id={`poll-response--radio-${index + 1}`} value={choice} checked={selected} /> 40 41 <label className={labelClass} htmlFor={`poll-response--radio-${index + 1}`} onClick={handleClick(choice)}>{ choice }</label> 42 </div> 43 ); 44 45 }) 46 } 47 </div> 48 49 <button type="button" className={`btn btn-primary text-uppercase my-5 ml-4 px-5 py-3 d-block ${selectedChoice ? '' : 'in'}visible`} disabled={!selectedChoice} onClick={this.handleSubmit}>Submit</button> 50 51 </Fragment> 52 ); 53 } 54 55 } 56 57 export default Poll;
Here in the Poll component, we first initialized the state of the component with a null selected property. The selected property will contain the selected choice for the poll.
In the render() method, you will notice that two props, question and choices are required for the Poll component. We simply render the question and then loop through the choices, rendering each one with a custom radio <input> for selection.
Selecting a choice updates the state selected property to the selectedChoice using an onClick() event handler. It then reveals a <button>, which will be used to submit the selected choice.
The submit <button> when clicked, triggers the handleSubmit() event handler. The handleSubmit() method simply makes a POST HTTP request to an /answer endpoint (which we will implement later on the server). It also resets the state selected property to null.
Next, we will add some global styles to the index page for additional styling of the Poll elements. Make the following changes to the pages/index.js file. The default export should look like the following snippet:
1/* pages/index.js */ 2 3 export default () => ( 4 <Fragment> 5 <IndexPage /> 6 <style global jsx>{` 7 8 .custom-control-label { 9 background: transparent; 10 color: #999; 11 font-size: 2rem; 12 font-weight: 500; 13 cursor: pointer; 14 line-height: 2.25rem; 15 } 16 17 .custom-control-label:before, .custom-control-label:after { 18 top: 0; 19 left: -10px; 20 height: 2.25rem; 21 width: 2.25rem; 22 cursor: pointer; 23 box-shadow: none !important; 24 } 25 26 .custom-control-label.checked { 27 color: #007bff !important; 28 } 29 30 button.btn { 31 letter-spacing: 1px; 32 font-size: 1rem; 33 font-weight: 600; 34 } 35 36 `}</style> 37 </Fragment> 38 );
Here, we employed the styled-jsx styling option bundled into Next.js to provide support for isolated scoped CSS. You can learn more about how it works here.
Building the stats component
Create a new Stats.js file inside the components directory and add the following content:
1/* components/Stats.js */ 2 3 import React, { Fragment } from 'react'; 4 import { Line } from 'react-chartjs-2'; 5 6 const Stats = props => { 7 8 const { choices = [], stats = {} } = props; 9 const counts = choices.map(choice => stats[choice] || 0); 10 const totalCount = counts.reduce((total, count) => total + count, 0); 11 12 const chartData = { 13 labels: choices, 14 datasets: [ 15 { 16 lineTension: 0, 17 backgroundColor: 'rgba(68, 204, 153, 0.05)', 18 borderColor: 'rgba(68, 204, 153, 0.9)', 19 borderWidth: 2, 20 borderJoinStyle: 'round', 21 pointRadius: 5, 22 pointBorderColor: '#fff', 23 pointBackgroundColor: 'rgba(68, 204, 153, 0.9)', 24 pointBorderWidth: 3, 25 data: counts 26 } 27 ] 28 }; 29 30 const chartOptions = { 31 layout: { padding: { top: 25, bottom: 75, left: 75, right: 75 } }, 32 maintainAspectRatio: false, 33 scales: { 34 yAxes: [{ 35 ticks: { beginAtZero: true, display: false } 36 }] 37 }, 38 legend: { display: false }, 39 title: { 40 display: true, 41 text: 'POLL COUNTS', 42 padding: 10, 43 lineHeight: 4, 44 fontSize: 20, 45 fontColor: '#677' 46 } 47 }; 48 49 return <Fragment></Fragment> 50 51 }; 52 53 export default Stats;
The Stats component is stateless. Notice that we imported the Line export from the react-chartjs-2 module. This will enable us plot line-charts for data visualization. The Stats component requires two props:
choices- an array of poll choices passed from the parent component.stats- an object of poll choices passed from the parent component. The objectkeysare the choices, while thevaluesmap to the number of times each choice has been selected.
We extract the poll counts to a separate array and also store the total count in a variable using the .map() and .reduce() array methods.
Next, we construct the data and options objects for the line chart we want to create. Notice that we set the choices array as our chart labels and the counts array as our chart dataset. You can check the Chart.js Docs to learn more about the available chart types and the options.
Let’s go ahead and add the nodes we want to render in the Stats component. Modify the Stats component you just created. The return statement should look like the following snippet:
1/* components/Stats.js */ 2 3 return ( 4 <Fragment> 5 6 <div className="position-relative h-50 w-100 d-flex align-items-center border-bottom border-gray"> 7 <Line data={chartData} width={100} height={50} options={chartOptions} /> 8 </div> 9 10 <div className="position-relative h-50 w-100 d-flex flex-wrap align-items-start align-content-start"> 11 12 <div className="d-flex flex-wrap w-100 text-center justify-content-center align-items-center align-content-center" style={{ height: 'calc(100% - 150px)' }}> 13 <span className="d-block w-100 text-uppercase pb-2 font-weight-bold text-secondary" style={{ fontSize: '1.25rem' }}>Total Count</span> 14 <span className="d-block w-100 text-dark" style={{ fontSize: '5rem' }}>{totalCount}</span> 15 </div> 16 17 <div className="w-100 d-flex justify-content-between align-items-center text-center border-top border-gray" style={{ height: 100 }}> 18 { 19 counts.map((count, index) => { 20 const className = ['h-100 position-relative d-flex align-items-center', index > 0 ? 'border-left border-gray' : ''].join(' '); 21 22 return ( 23 <div key={index} className={className} style={{ width: '20%', fontSize: '2rem' }}> 24 <span className="d-block w-100 p-3 text-dark">{count}</span> 25 </div> 26 ); 27 }) 28 } 29 </div> 30 31 <div className="w-100 d-flex justify-content-between align-items-center text-center border-top border-gray bg-light" style={{ height: 50 }}> 32 { 33 choices.map((choice, index) => { 34 35 const className = ['h-100 position-relative d-flex align-items-center', index > 0 ? 'border-left border-gray' : ''].join(' '); 36 37 return ( 38 <div key={index} className={className} style={{ width: '20%', fontSize: '0.7rem' }}> 39 <span className="d-block w-100 text-uppercase p-3 font-weight-bold text-secondary">{choice}</span> 40 </div> 41 ); 42 43 }) 44 } 45 </div> 46 47 </div> 48 49 </Fragment> 50 );
We are rendering a Line chart using the chartData and chartOptions we defined earlier. You can learn more about how to configure the chart by checking the [react-chartjs-2](https://github.com/jerairrest/react-chartjs-2) package.
We also render the totalCount, as well as the counts for each of the choices. This is all we need for our Stats component.
Completing the index page component
It’s time for us to complete the index page component. We will need to set up Pusher and bind to a channel. We will also need to bring in the Poll and Stats components we just created. Edit the pages/index.js file, modifying the IndexPage component to contain the following code snippet:
1/* pages/index.js */ 2 3 class IndexPage extends Component { 4 5 state = { answers: {} } 6 7 componentDidMount() { 8 9 this.pusher = new Pusher(process.env.PUSHER_APP_KEY, { 10 cluster: process.env.PUSHER_APP_CLUSTER, 11 encrypted: true 12 }); 13 14 this.channel = this.pusher.subscribe('poll-board'); 15 16 this.channel.bind('new-answer', ({ choice, count }) => { 17 let { answers } = this.state; 18 answers = { ...answers, [choice]: count }; 19 this.setState({ answers }); 20 }); 21 22 this.pusher.connection.bind('connected', () => { 23 axios.post('/answers') 24 .then(response => { 25 const answers = response.data.answers; 26 this.setState({ answers }); 27 }); 28 }); 29 30 } 31 32 componentWillUnmount() { 33 this.pusher.disconnect(); 34 } 35 36 // render() method here ... 37 38 }
Here is a simple break down of what we've done:
-
We first initialized the state to contain an empty
answersobject property. Thisanswersproperty will be updated as new answers come in. When the component mounts, we set up a Pusher connection and achannelsubscription inside thecomponentDidMount()lifecycle method. -
You can see that we are subscribing to a Pusher channel called
poll-board. We are then binding to thenew-answerevent on the channel, which is triggered from the server when a new answer is received. Next, we simply update the stateanswersproperty using the updated stats we receive from the server. -
Also, on the
componentDidMount()method, we are binding to theconnectedevent on the Pusher client, when it is freshly connected, to fetch the current answers stats from the server by making aPOST /answersHTTP request using theaxioslibrary. Afterwards, we update the stateanswersproperty using the updated stats we receive from the server.
Next, we will import the Poll and Stats components we just created and attach them to the rendered DOM. Begin by importing the new components into the pages/index.js file:
1/* pages/index.js */ 2 3 import axios from 'axios'; 4 import Pusher from 'pusher-js'; 5 import Poll from '../components/Poll'; 6 import Stats from '../components/Stats';
Next, add the new components to the <section> elements in the render() method. Your render() method should look like the following snippet:
1/* pages/index.js */ 2 3 render() { 4 const question = `Which is the largest continent in the world by population?`; 5 const choices = ['Africa', 'Asia', 'Europe', 'North America', 'South America']; 6 7 return ( 8 <Layout pageTitle="Realtime Data Visualization"> 9 <main className="container-fluid position-absolute h-100 bg-light"> 10 <div className="row position-absolute w-100 h-100"> 11 12 <section className="col-md-7 d-flex flex-row flex-wrap align-items-center align-content-center px-5 border-right border-gray"> 13 <div className="px-5 mx-5"> 14 <Poll question={question} choices={choices} /> 15 </div> 16 </section> 17 18 <section className="col-md-5 position-relative d-flex flex-wrap h-100 align-items-start align-content-between bg-white px-0"> 19 <Stats choices={choices} stats={this.state.answers} /> 20 </section> 21 22 </div> 23 </main> 24 </Layout> 25 ); 26 }
Here, we added a question and the corresponding choices and pass them to the Poll component as props. We are also passing the choices array alongside this.state.answers to the Stats component.
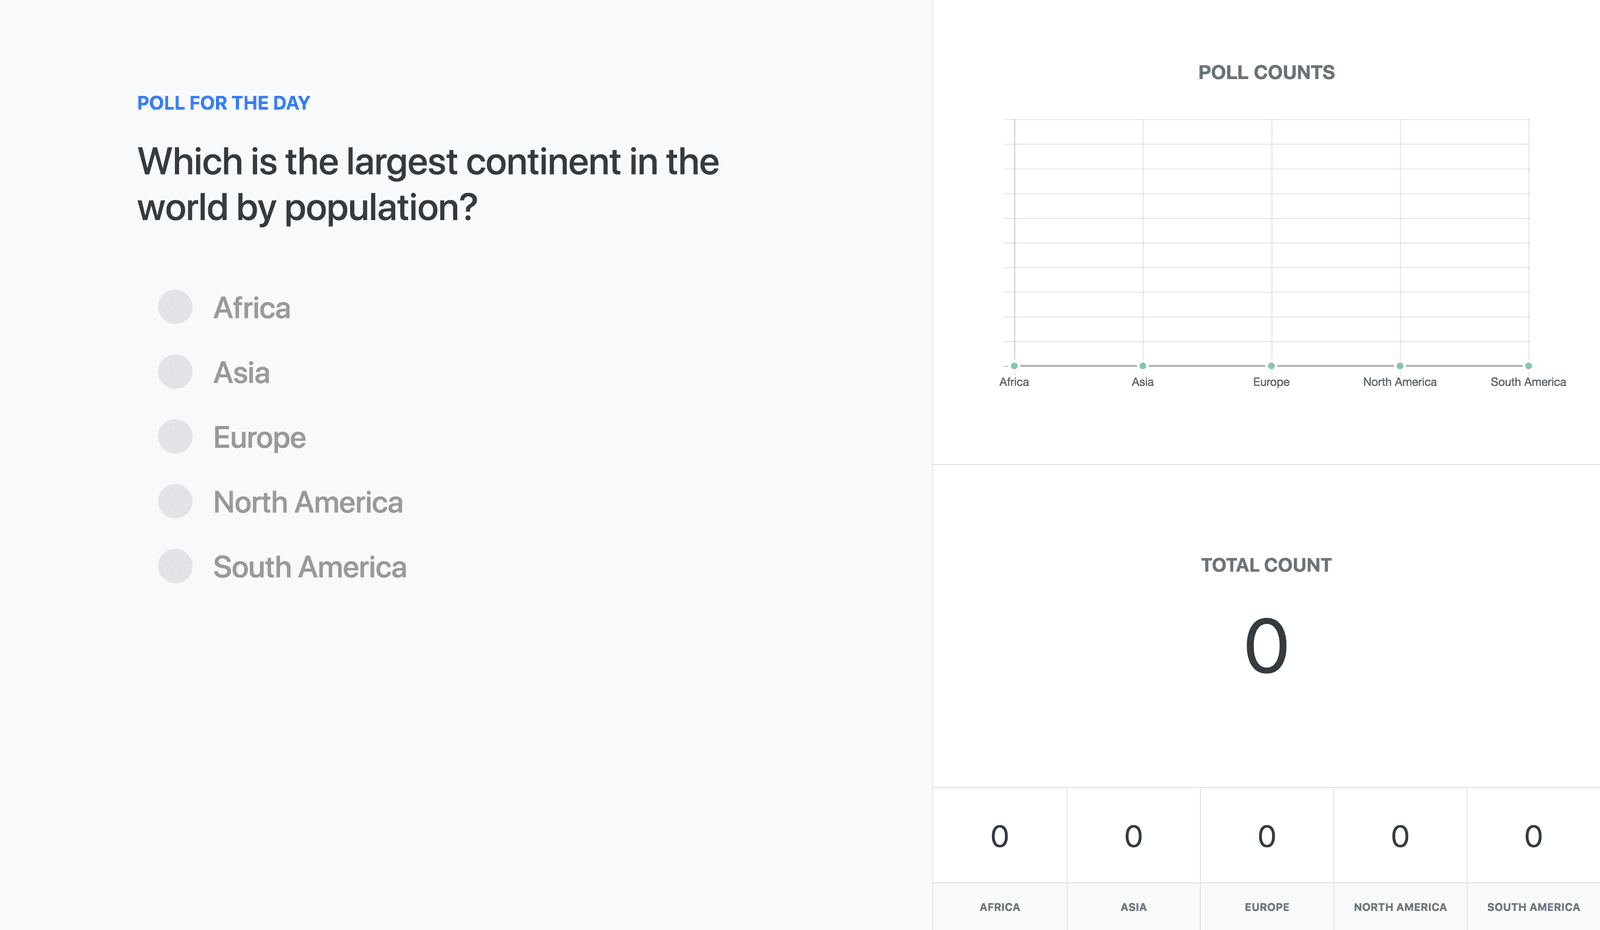
So far, our index page is complete and everything is working perfectly, except one little bit. If you test the app in your browser, with npm run dev, you should see this screen:
Adding the answer routes
As you might have observed, trying to submit your answer didn’t change the data visualization. This is because we have not yet implemented the /answer and /answers routes on the server. Let’s go ahead and do that.
Modify the server.js file and add the following just before the call to server.listen() inside the then() callback function.
1/* server.js */ 2 3 // server.get('*') is here ... 4 5 let answers = {}; 6 7 server.post('/answer', (req, res, next) => { 8 const { choice = null } = req.body; 9 10 if (choice) { 11 const hasChoice = choice in answers && typeof answers[choice] === 'number'; 12 const count = ( hasChoice ? Math.max(0, answers[choice]) : 0 ) + 1; 13 14 answers = { ...answers, [choice]: count }; 15 16 pusher.trigger('poll-board', 'new-answer', { choice, count }); 17 } 18 }); 19 20 server.post('/answers', (req, res, next) => { 21 res.json({ answers, status: 'success' }); 22 }); 23 24 // server.listen() is here ...
First, we created a kind of in-memory store for our answers stats, to keep track of the answer counts. This is useful for new clients that join the channel to see up-to-date stats. Whenever the Pusher client makes a POST request to the /answers endpoint on connection, it gets all the up-to-date answers stats in the returned response.
On the POST /answer route, we are fetching the selected choice from req.body through the help of the body-parser middleware we added earlier. Next, we fetch the count for the selected choice from the answers object and increment it by 1.
Finally, we update the answers stats to reflect the increment, and then trigger a new-answer event on the poll-board Pusher channel, passing the updated answers stats. This does the realtime magic.
Bravo. If you made it to this point, then you have successfully built a realtime data visualization app using Next.js and Pusher. Test the app now in your browser to see that everything works.
Conclusion
In this tutorial, we have been able to build a very simple realtime data visualization application using Next.js, React, Chart.js and Pusher Channels. You can check the source code of this tutorial on GitHub.
In the bid to keep this tutorial as simple as possible, we were only interested in the poll counts. In a real application, you may want to do stuff like time-based visualization, polling rate visualization and statistical analysis of results in realtime.
Do check the documentation for each technology we used in this project to learn more about other ways of using them. I duly hope that this tutorial is of help to you.


© 2024 Pusher Ltd. All rights reserved.
Pusher Limited is a company registered in England and Wales (No. 07489873) whose registered office is at MessageBird UK Limited, 3 More London Riverside, 4th Floor, London, United Kingdom, SE1 2AQ.